The Accounts · daily brief
9 June 2026
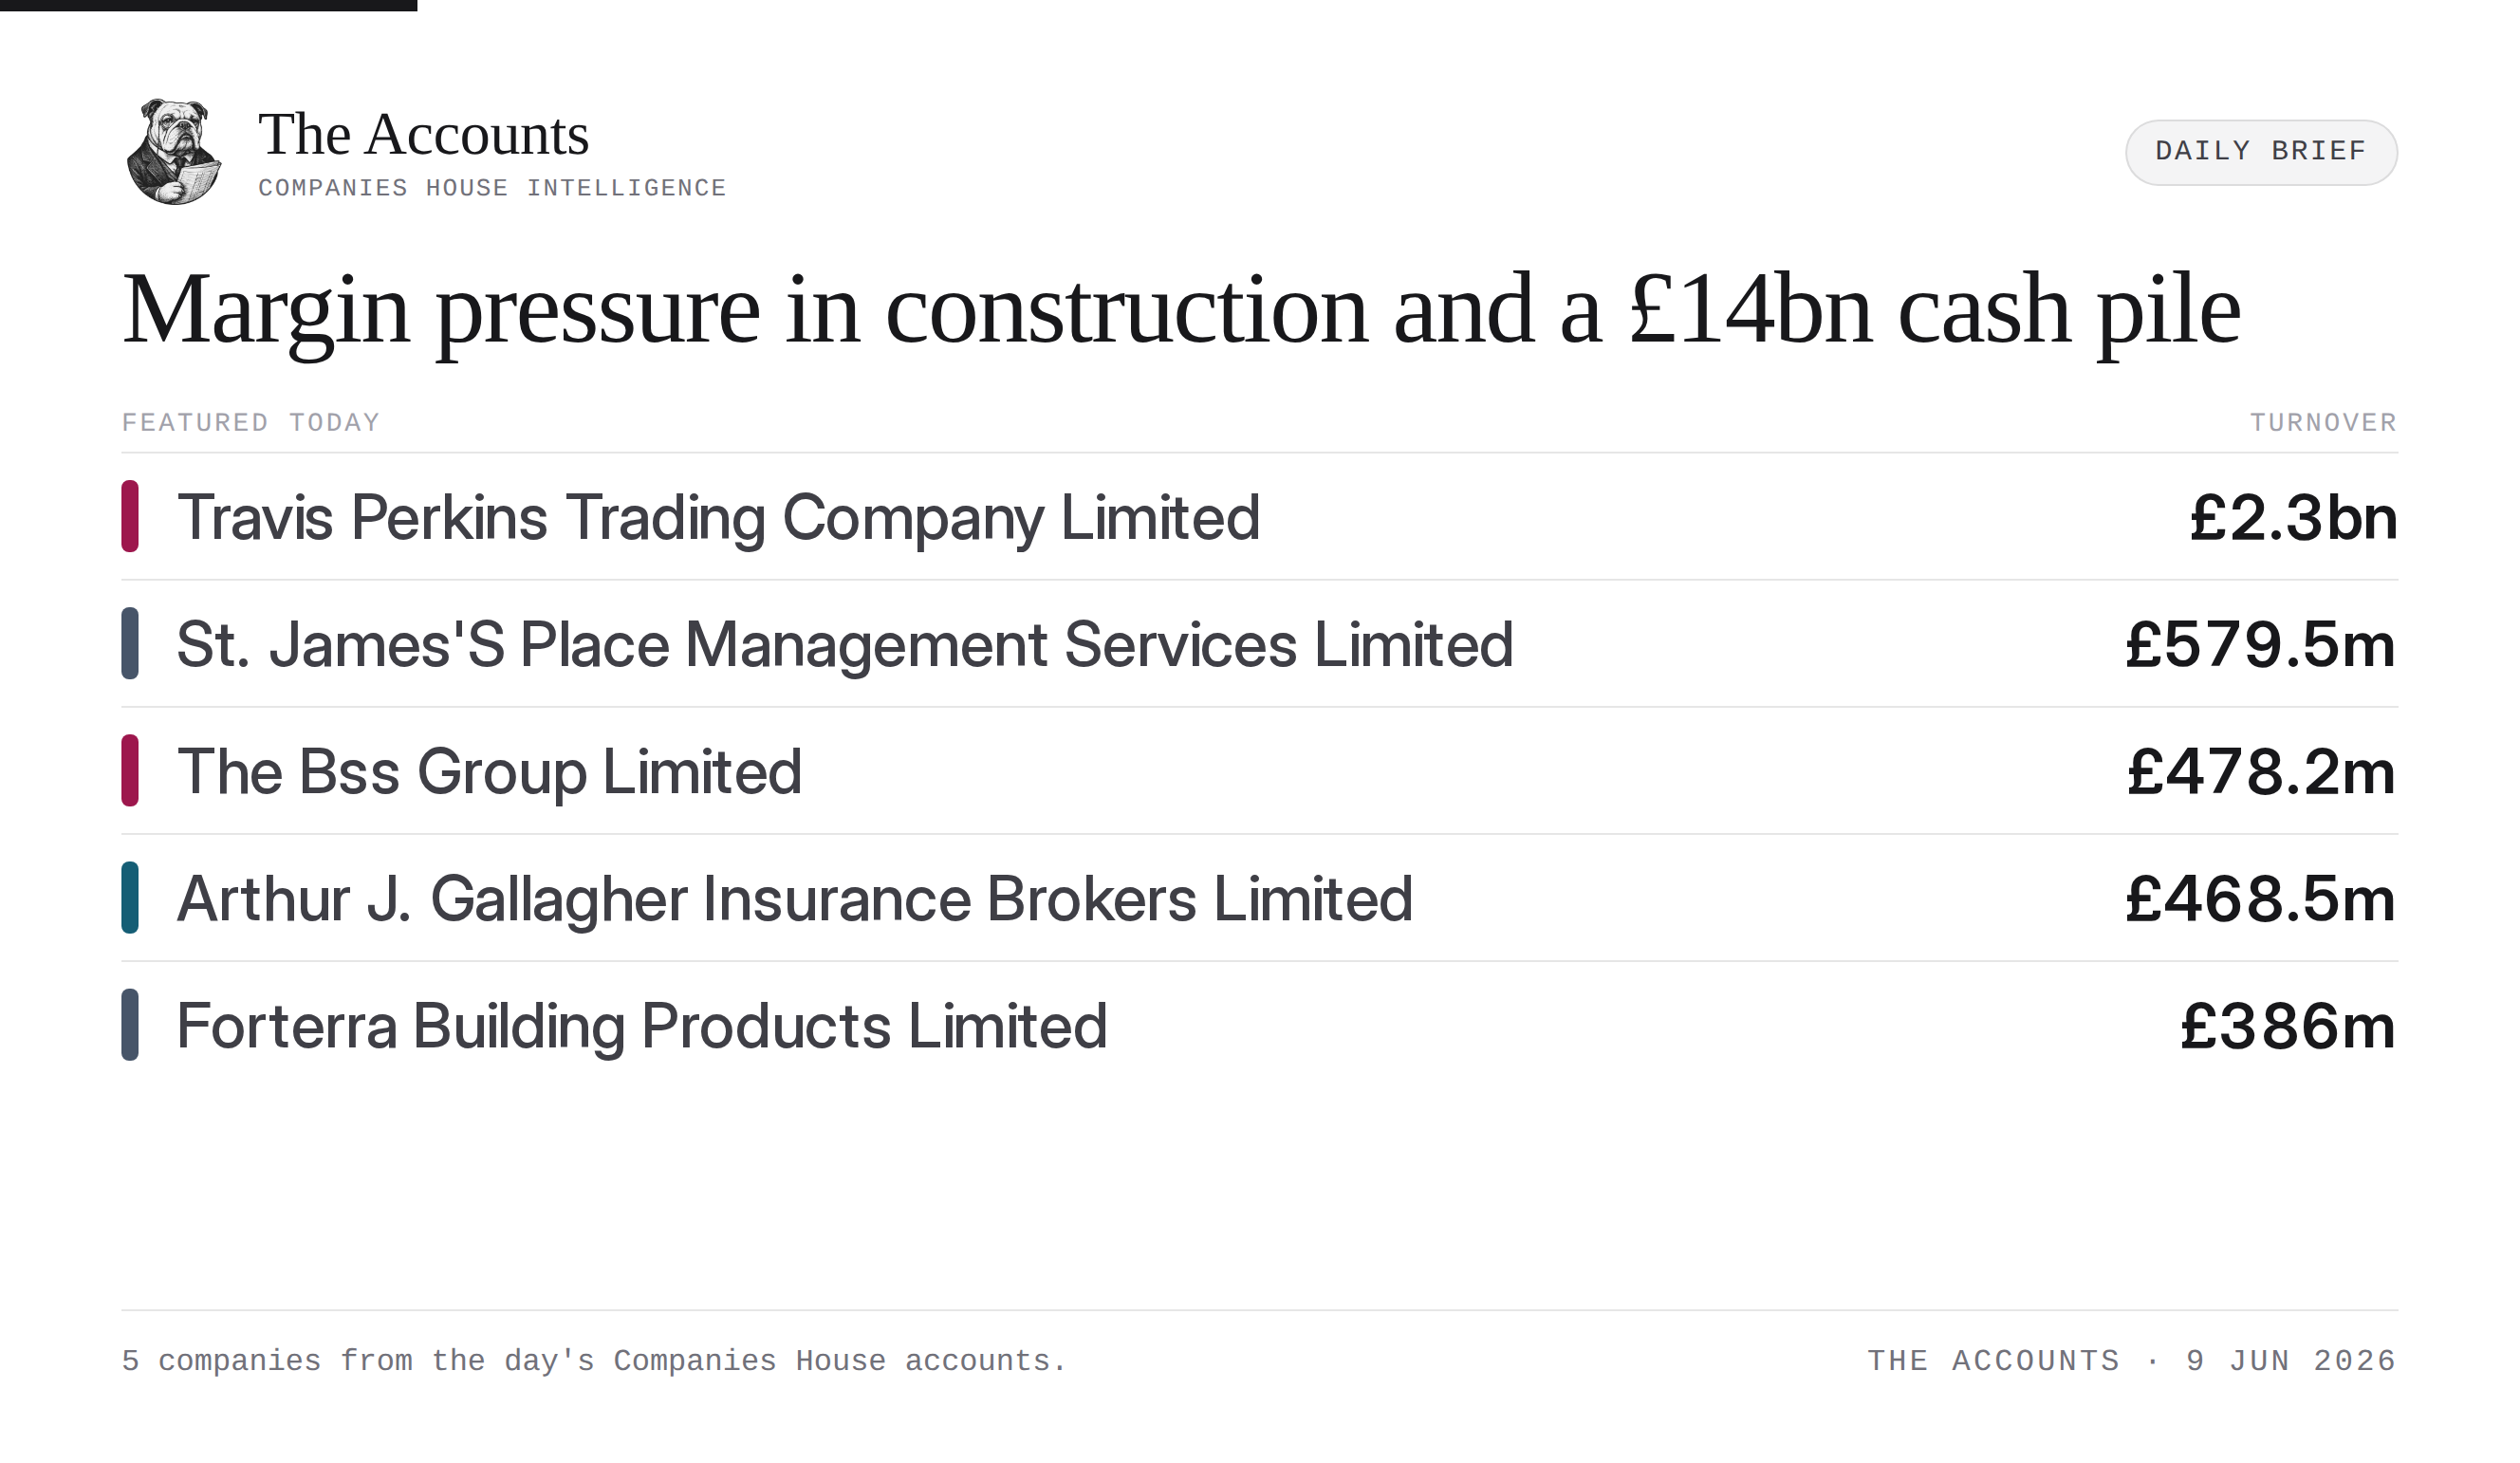
Margin pressure in construction and a £14bn cash pile
The takeaways
- LME Clear holds a £14.1bn cash pile against just £143.9m in turnover
- Two construction suppliers saw profits contract alongside rising administrative costs
- Staff costs at St. James's Place Management Services rose 7% while average headcount fell
Hiring signals · who grew, who shrank
Hiring
- Royal Norfolk Agricultural Association 20 → 59 staff ▲ +195% staff cost +102%
- Capricorn Energy Plc 28 → 41 staff ▲ +46% staff cost +3%
Cutting
- Staffline Recruitment (Ni) Limited 135 → 103 staff ▼ −24% staff cost −6%
- Forrest Brown Limited 114 → 92 staff ▼ −19% staff cost −6%
Average headcount from the accounts filed yesterday — a look back at last year's payroll, not a live hiring tracker.
Filing of note
Lme Clear Limited
Holds £14.14bn of cash on £143.9m of turnover.
| Line | FY25 | FY24 | YoY |
|---|---|---|---|
| Profit & loss | |||
| Turnover | £143.9m | £132.3m | ▲ +9% |
| Finance costs | £391.7m | £499.1m | ▼ −22% |
| Profit before tax | £67.2m | £58.5m | ▲ +15% |
| Net profit | £50.5m | £43.8m | ▲ +15% |
| Cash & balance sheet | |||
| Cash | £14.1bn | £8.2bn | ▲ +73% |
| Net assets | £303.5m | £333.2m | ▼ −9% |
| Dividends paid | £81.6m | £0 | |
| People & pay | |||
| Avg. headcount | 83 | 75 | ▲ +11% |
| Staff cost | £77.6m | £73.5m | ▲ +6% |
| Director pay | £2.8m | £2.5m | ▲ +11% |
| Highest-paid director | £1.6m | £1.4m | ▲ +14% |
A notable balance sheet holds £14.1bn of cash alongside £143.9m of turnover. As a clearing house, these substantial cash balances reflect clearing members' margin rather than operational revenue, generating £437.5m in finance income alongside £391.7m in finance costs. Stripping away the interest lines, core turnover grew 9%, while pre-tax profit rose 15% to £67.2m.
Travis Perkins Trading Company Limited [1]
Profits double
| Line | FY25 | FY24 | YoY |
|---|---|---|---|
| Profit & loss | |||
| Turnover | £2.3bn | £2.3bn | ▼ −0% |
| Gross profit | £641.2m | £645.1m | ▼ −1% |
| Admin expenses | £160.5m | £145.6m | ▲ +10% |
| Profit before tax | £32.7m | £16.2m | ▲ +102% |
| Net profit | £44.4m | −£3.7m | ▲ +1300% |
| Cash & balance sheet | |||
| Cash | £6.2m | £10.1m | ▼ −39% |
| Net assets | £383.9m | £388.7m | ▼ −1% |
| Dividends paid | — | £384.4m | |
| People & pay | |||
| Avg. headcount | 8,579 | 8,437 | ▲ +2% |
| Staff cost | £367m | £338.8m | ▲ +8% |
| Director pay | £600k | £1.4m | ▼ −57% |
| Highest-paid director | £300k | £300k | ▲ −0% |
Broadly flat revenue coincided with this principal operating subsidiary doubling its pre-tax profit to £32.7m. The bottom-line improvement occurred alongside administrative expenses rising 10% to £160.5m. Total staff costs rose 8% to £367m as average headcount expanded to 8,579, while directors' remuneration moved in the opposite direction, more than halving to £600k.
St. James'S Place Management Services Limited [2]
Deepening loss
| Line | FY25 | FY24 | YoY |
|---|---|---|---|
| Profit & loss | |||
| Turnover | £579.5m | £523.1m | ▲ +11% |
| Gross profit | £1.5m | £1.6m | ▼ −7% |
| Admin expenses | £185m | £112.6m | ▲ +64% |
| Operating profit | −£183.5m | −£111.1m | ▼ −65% |
| Finance costs | £20.2m | £22.7m | ▼ −11% |
| Profit before tax | −£196m | −£124.8m | ▼ −57% |
| Net profit | −£138.7m | −£87.7m | ▼ −58% |
| Cash & balance sheet | |||
| Cash | £9.9m | £7.8m | ▲ +26% |
| Net assets | £14.5m | £11.4m | ▲ +28% |
| People & pay | |||
| Avg. headcount | 2,358 | 2,473 | ▼ −5% |
| Staff cost | £278.6m | £260.6m | ▲ +7% |
| Director pay | £228k | £252k | ▼ −10% |
| Highest-paid director | £147.1m | £245.4m | ▼ −40% |
The wealth manager's support services arm saw its pre-tax loss widen to £196m as administrative expenses expanded by 64%. Turnover grew 11%, while the broader cost base rose at a faster rate. Total staff costs climbed 7% to £278.6m during the period, while average headcount dropped by more than a hundred. The accounts note a standard letter of group support regarding the going concern basis.
The Bss Group Limited [3]
Margins squeezed
| Line | FY25 | FY24 | YoY |
|---|---|---|---|
| Profit & loss | |||
| Turnover | £478.2m | £459.5m | ▲ +4% |
| Gross profit | £110.3m | £111m | ▼ −1% |
| Admin expenses | £41.5m | £35m | ▲ +19% |
| Operating profit | £11m | £17.5m | ▼ −37% |
| Finance costs | £1.8m | — | |
| Profit before tax | £10.3m | £20.2m | ▼ −49% |
| Net profit | £5.8m | £12.8m | ▼ −55% |
| Cash & balance sheet | |||
| Cash | £7.2m | £6.7m | ▲ +7% |
| Net assets | £130.6m | £188.9m | ▼ −31% |
| Dividends paid | £58.9m | £100k | ▲ +58800% |
| People & pay | |||
| Avg. headcount | 1,218 | 1,206 | ▲ +1% |
| Staff cost | £52.5m | £48.2m | ▲ +9% |
| Director pay | £928k | £275k | ▲ +238% |
| Highest-paid director | £154k | £225k | ▼ −32% |
Rising revenue coincided with a lower bottom line at this Travis Perkins subsidiary, where operating profit fell 37% to £11m. A £6.5m rise in administrative expenses outpaced the modest top-line growth. The period also saw total directors' remuneration more than triple to £928k.
Arthur J. Gallagher Insurance Brokers Limited [4]
Dividend throttled
| Line | FY25 | FY24 | YoY |
|---|---|---|---|
| Profit & loss | |||
| Turnover | £468.5m | £483.6m | ▼ −3% |
| Gross profit | £468.5m | £483.6m | ▼ −3% |
| Admin expenses | −£341.5m | −£343.5m | ▲ +1% |
| Operating profit | £128m | £139.5m | ▼ −8% |
| Profit before tax | £147.3m | £159.5m | ▼ −8% |
| Net profit | £127.6m | £142.4m | ▼ −10% |
| Cash & balance sheet | |||
| Cash | £277.6m | £303.2m | ▼ −8% |
| Net assets | £246.9m | £199.3m | ▲ +24% |
| Dividends paid | −£80m | −£340.8m | ▲ +77% |
| People & pay | |||
| Director pay | £2m | £2.3m | ▼ −12% |
| Highest-paid director | £1.3m | £688k | ▲ +82% |
A year of slight contraction for the UK arm of the American insurance brokerage. Turnover dipped 3% to £468.5m, while pre-tax profit moved down 8% to £147.3m. A notable movement occurred on the balance sheet, where the dividend payout was reduced from £340.8m in the prior year to £80m.
Forterra Building Products Limited [5]
Costs bite
| Line | FY25 | FY24 | YoY |
|---|---|---|---|
| Profit & loss | |||
| Turnover | £386m | £344.3m | ▲ +12% |
| Gross profit | £121.5m | £103m | ▲ +18% |
| Admin expenses | £34.6m | £26.6m | ▲ +30% |
| Operating profit | £29m | £36.7m | ▼ −21% |
| Finance costs | £6m | £9.1m | ▼ −34% |
| Profit before tax | £23m | £27.6m | ▼ −17% |
| Net profit | £16.8m | £20.2m | ▼ −17% |
| Cash & balance sheet | |||
| Cash | £6.1m | £15.2m | ▼ −60% |
| Net assets | £241.8m | £229.9m | ▲ +5% |
| Dividends paid | £5.9m | £22m | ▼ −73% |
| People & pay | |||
| Avg. headcount | 1,459 | 1,472 | ▼ −1% |
| Staff cost | £102.4m | £88.1m | ▲ +16% |
| Director pay | £1.3m | £900k | ▲ +44% |
| Highest-paid director | £500k | £300k | ▲ +67% |
Top-line growth of 12% coincided with a lower profit for the brick and block manufacturer. Operating profit slid 21% to £29m, alongside a 30% rise in administrative expenses and £6.7m in exceptional items. Total staff costs pushed 16% higher to £102.4m, outpacing a broadly flat average headcount.
Just remember: revenue is vanity, profit is sanity, and holding £14 billion of other people's cash is a clearing house.
Sources
- Travis Perkins Trading Company Limited
- St. James'S Place Management Services Limited
- The Bss Group Limited
- Arthur J. Gallagher Insurance Brokers Limited
- Forterra Building Products Limited